Explore our comprehensive roughness chart guide with clear surface finish values symbols conversions and manufacturing process insights.
Understanding Surface Roughness Key Concepts and Parameters
Ever wonder what all those surface roughness terms mean and why they matter? Whether you’re designing a part or checking quality, getting the basics right is key.
Core Terminology: Roughness, Waviness, and Lay
- Roughness is the small, fine irregularities on a surface created by manufacturing processes.
- Waviness refers to more widely spaced surface deviations, like ripples or waves.
- Lay is the dominant pattern or direction of the surface texture, usually linked to how the part was made (e.g., machining marks).
Understanding these helps you communicate exactly what finish you need.
Key Roughness Parameters
Here’s a quick breakdown of the main roughness measurements you’ll see:
- Ra (Arithmetic Average Roughness)This is the average height of surface deviations from the centerline. The formula sums the absolute values of the roughness profile over a measured length, then divides by that length. Ra is the most common go-to spec because it’s simple and works well for general applications.
- Rz (Mean Peak-to-Valley Height)Rz measures the average distance between the highest peak and the lowest valley in multiple sample lengths. It’s better for functional surfaces, like seals, where peak and valley height impact performance directly.
- RMS (Root Mean Square)RMS calculates the square root of the average of the squared deviations. It’s a legacy metric that’s slightly more sensitive to larger deviations than Ra. Use RMS when precision and data comparison across legacy systems matter.
- Other Values
- Rt (Total Height): The full vertical distance between the highest peak and the lowest valley across the entire measured sample.
- Rmax (Maximum Roughness Depth): The deepest single roughness depth in the measured area.
Visual Comparison of Smooth vs Rough Profiles
Imagine a smooth glass surface versus a rough sandpaper surface. The glass has low Ra and Rt values, showing minimal deviations. Sandpaper shows high peaks and valleys, highlighted by larger Rz and Rt values. This difference tells you how light, friction, or seals will behave on these surfaces.
Pro Tip on Tolerances and Design
Tighter Ra values mean smoother finishes, which often come at higher manufacturing costs. For example, medical implants usually require very tight tolerances (low Ra) to ensure biocompatibility and reduce irritation. On the other hand, rougher finishes might benefit applications needing better adhesion or oil retention.
Keep your design’s end use in mind when specifying roughness — it’s a balance between function, cost, and manufacturing capability.
Want to get started specifying the right surface roughness for your next project? Let’s dive into essential roughness chart values and conversions next.
The Essential Roughness Chart Values Symbols and Conversions
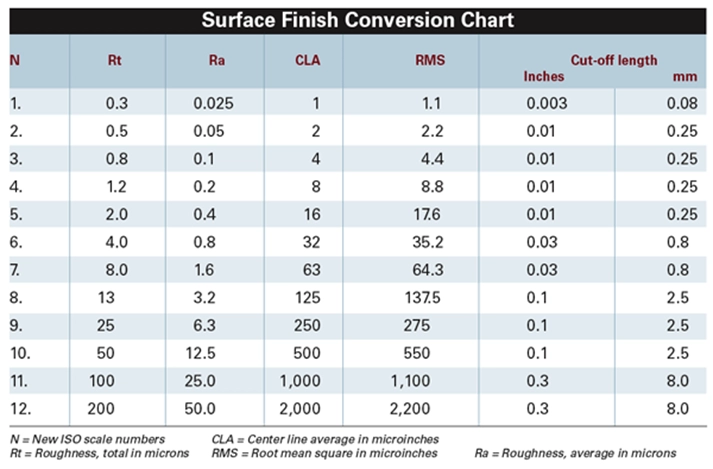
To simplify surface roughness specs, using a roughness chart is a game-changer. At Vast, we provide an interactive roughness chart that lays out key parameters like Ra, Rz, and RMS in both micrometers (μm) and microinches (μin), along with N-scale surface finish grades from 1 to 12.
Here’s how the chart breaks down:
- Columns list the parameters and their value ranges. For example, Ra spans from 0.025 μm (super smooth) up to 50 μm (very rough).
- Equivalent symbols include ISO triangular notations you often see on engineering drawings.
- Rows display surface finish grades from N1, representing a mirror polish with Ra around 0.025 μm, all the way to N12, which corresponds to coarse processes like sawing (Ra ~50 μm).
Conversions Made Simple
To move between common roughness measurements:
- Ra ≈ 1.11 × RMS
This formula helps translate Root Mean Square values to Ra, which is widely used in specs.
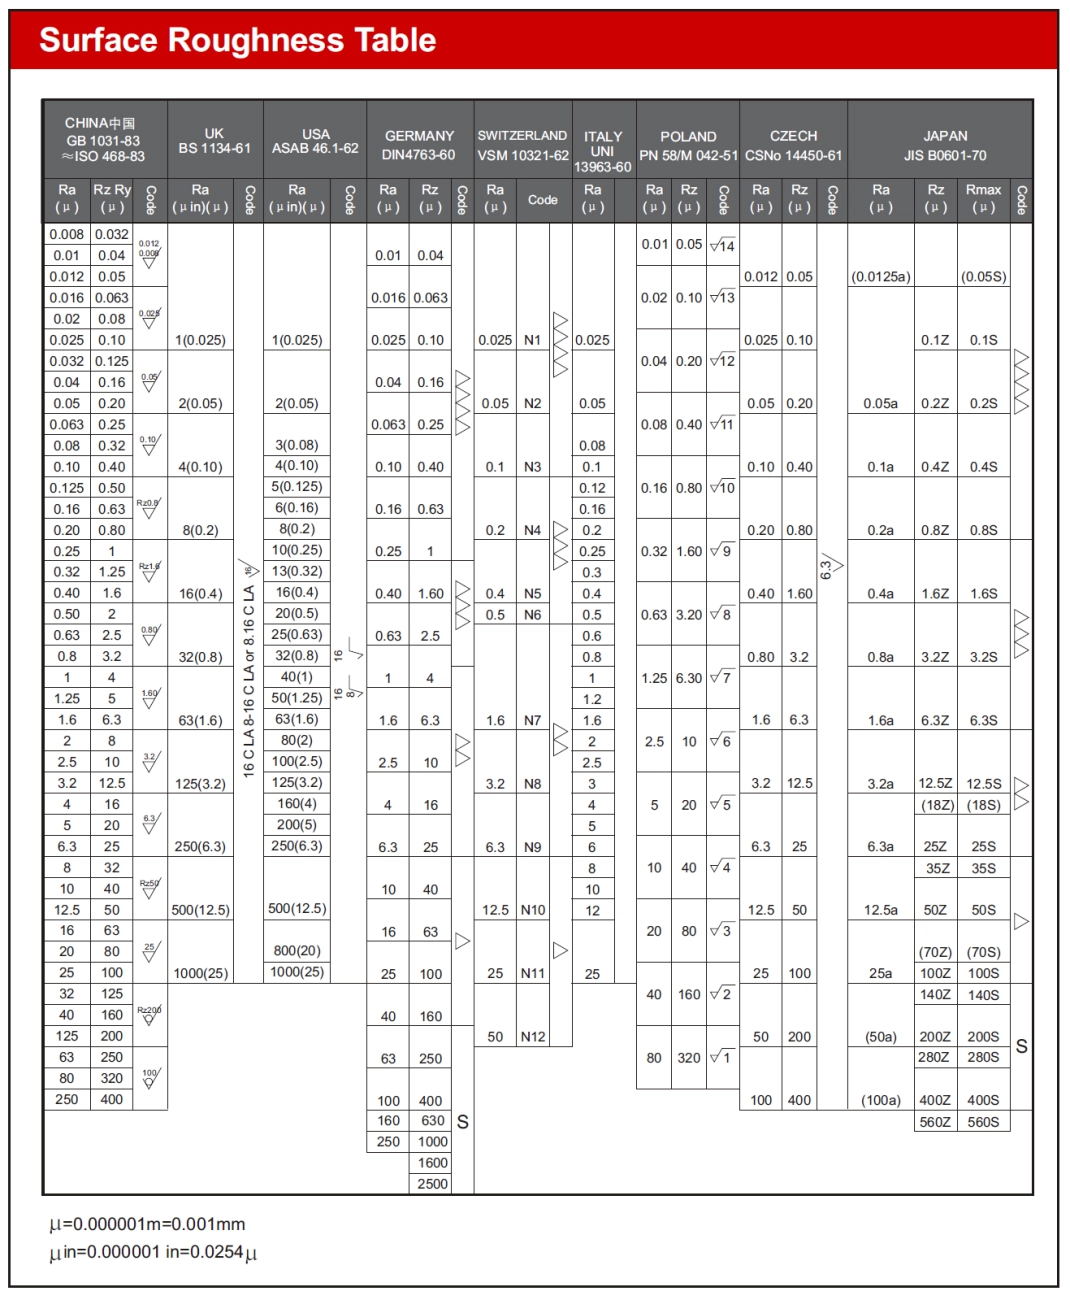
We also include handy conversion tables for:
- Microinch (μin) to micrometer (μm)
- ISO vs ANSI roughness symbols and grades
What Does a Ra of 3.2 μm Look Like?
If you’re wondering how rough a Ra of 3.2 μm really feels, think about everyday surfaces:
- It’s rougher than a glass window but smoother than standard sandpaper.
- Typically found in machined metal parts and offers a balance between smoothness and grip.
This visualization helps engineers and designers pick the right surface finish for their applications without second-guessing.
Surface Roughness by Manufacturing Process A Practical Comparison
Choosing the right surface roughness starts with understanding how different manufacturing processes affect the finish and cost. Each method offers a typical roughness range based on how the process works and the materials involved.
| Process | Typical Ra Range (μm) |
|---|---|
| Milling | 1.6 – 6.3 |
| Turning | 0.8 – 3.2 |
| Grinding | 0.4 – 1.6 |
| Polishing | 0.05 – 0.2 |
| EDM | 0.4 – 1.5 |
| Laser Cutting | 2.5 – 12 |
Factors like tool wear, feed rate, and the material being machined—say aluminum versus steel—also influence the final roughness. Softer metals like aluminum usually finish smoother at the same settings.
Real-World Examples
- Automotive: Rougher finishes on engine pistons (around Ra 3.2 – 6.3 μm) help retain oil better, improving performance and durability.
- Aerospace: Turbine blades demand ultra-smooth surfaces (Ra below 0.2 μm) to reduce drag and increase fuel efficiency.
At Vast, our CNC machining capabilities consistently reach Ra values below 0.8 μm. Whether you need precision for aerospace or functional automotive parts, we can deliver smooth, reliable finishes. Contact us for quotes and custom solutions focused on your surface finish needs.
Measuring and Specifying Surface Roughness Tools and Best Practices
When it comes to measuring surface roughness, two main methods dominate: contact stylus profilometers and non-contact optical lasers. Each has its place depending on your needs.
- Contact Stylus ProfilometersThese devices use a tiny diamond-tipped stylus that physically traces the surface. They’re highly accurate and great for detailed measurements, but they can be slower and risk damaging soft surfaces.
Pros: High precision, well-established method
Cons: Slower, possible surface damage - Non-Contact Optical Laser SystemsThese use light to scan surfaces without touching them. They’re faster and perfect for delicate or complex parts, but might struggle with very shiny or transparent materials.
Pros: Fast, no surface impact
Cons: May be less accurate on certain textures
| Method | Accuracy | Speed | Cost |
|---|---|---|---|
| Contact Stylus Profilometer | Very High | Medium | Moderate |
| Non-Contact Optical Laser | High | High | Higher |
Standards You Need to Know
For consistent, reliable specs, surface roughness follows standards like ISO 4287 and ASME B46.1. Both define parameters such as Ra, Rz, and others, but be sure to specify which one you’re using to avoid confusion—especially if your project spans US and international suppliers.
Specifying Roughness in Drawings
When you add roughness values to drawings:
- Use the correct surface finish symbols with the Ra or Rz values clearly marked
- Avoid over-specification—tight roughness tolerances can raise costs unnecessarily
- Confirm the cut-off length (the measured sample length) matches your application to ensure readings are meaningful
Common Pitfalls
- Ignoring cut-off length can skew results; always confirm it fits your part size and process
- Misreading the differences between Ra, Rz, and RMS can cause improper specs
- Overlooking lay direction and waviness can impact function but might be missed in a roughness chart
Keeping these measurement tools and standards in mind helps you get accurate, cost-effective surface specifications that fit your project goals perfectly.
Applications and Impacts Choosing the Right Roughness for Your Project
Picking the right surface roughness is crucial depending on what you’re making and how it’ll be used. Here’s a quick look at key industries and how roughness affects performance:
Medical devices
- Low Ra values (around 0.1–0.2 μm) are needed for biocompatibility and to prevent bacteria buildup.
- Smoother surfaces improve patient safety and device longevity.
Electronics
- Balanced roughness helps with solderability and electrical connections.
- Too smooth or too rough can cause poor adhesion or short circuits.
Optics
- Ultra-smooth finishes, often below 0.1 μm Ra, are critical for lenses and mirrors.
- Minimizes light scattering for better clarity and performance.
How Roughness Affects Performance
Surface roughness impacts several key factors:
- Tribology: Friction and wear rates change with roughness—smoother means less friction in many cases.
- Corrosion resistance: Rougher surfaces can trap moisture and speed corrosion.
- Fatigue life: Surfaces with controlled roughness withstand cyclic stress better.
Tips for Optimizing Surface Roughness
- Balance aesthetics, function, and budget—don’t over-specify roughness if it won’t add value.
- Use EDM for complex parts where tight Ra values are needed but machining is tough.
- Think about your specific application’s tolerance to roughness and choose accordingly to avoid unnecessary cost.
Choosing your roughness with these factors in mind saves money, improves product life, and ensures your parts perform exactly as they should.